Bloomberg - The Finance Lab
Bloomberg – The Finance Lab
IMT Ghaziabad has a full-fledged finance lab equipped with 12 Bloomberg Terminals for the benefit of students and faculty. It provides access to real-time global market data in global economics, equities, fixed income, currencies, commodities and enables portfolio construction, simulations, and live trading for the practical exposure of the students. The terminal allows access to market intelligence data for research and the latest industry reports, which can also be useful for knowledge creation and faculty research.
Bloomberg is a powerful and flexible platform for financial professionals that brings together real-time data on all market, news and research, analytics, and communication tools to make smarter, faster, more informed business decisions. Bloomberg has data on more than 5 million bonds, equities, commodities currencies, and funds. It covers almost every publicly traded company in the world, and has profiles on more than a million people.
Markets
Awareness, context, and analysis make Bloomberg the primary source for those who need to know what’s happening now and what might happen next. The Bloomberg Terminal delivers unparalleled coverage of markets and securities with information across asset classes from fixed income to equities, to foreign exchange, commodities, and derivatives integrated in one place and delivered in real-time to your desktop or mobile device.
Tools and charting
Bloomberg continually develop and apply cutting edge technologies to deliver best in class tools, such as custom desktop applications, portfolio monitors, market alerts, and charting capabilities that optimize user workflow. Bloomberg offer trading solutions across multiple asset classes and sophisticated pre- and post-trade analytics for both the buy-side and sell-side.
News
Bloomberg news is reported when it happens, from where it happens. With more than 2,700 news professionals in 120 countries, Bloomberg’s award-winning coverage of companies, markets, economies, politics, and governments ensures that you get the information you need when you need it most.
Research
Bloomberg has a broad range of research offerings including direct access to sell-side and independent research from more than 1,500 sources, as well as proprietary, analyst-driven research that provides a comprehensive view of industries and their key constituents with unsurpassed depth and breadth at the sector, industry and company levels.
Location of Finance Lab – Bloomberg Terminals
The Financial Lab has 12 Bloomberg terminals. The Lab is located on the Ground Floor of IMT Library.
Creating a Bloomberg Account
- Click on the Bloomberg desktop icon.
- Hit either Enter or <GO>.
- Click on “Create a new Login” and fill out your information and follow the instructions. You will need to include a mobile number. Use your current official email Id.
- Select the SMS Text option to receive your verification code. You will be sent a code via text message within a short time.
- Input the validation code and create your password according to their guidelines.
- Simply log in with your username and password to access.
Bloomberg Terminal
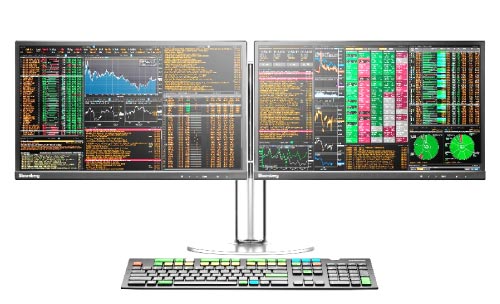
A Bloomberg Terminal will have two monitors and a unique keyboard.
The dual monitors are helpful as they allow Bloomberg users to view multiple displays simultaneously. Upon logging in, 4 individual panels or windows will open. Similar to the dual monitors, multiple panels allow users to multi-task, by viewing or comparing up to 4 different sets of data simultaneously. The active panel will show a blue flashing cursor. You can switch between panels using the <PANEL> key or by clicking on the panel that you wish to work on.
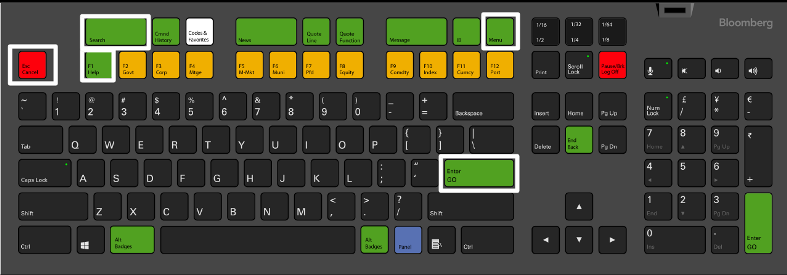
The Bloomberg Keyboard
Bloomberg Terminal will also have a unique keyboard. This keyboard is developed to make using the menu-driven navigation in Bloomberg Terminal easier. The Bloomberg keyboard is color-coded to provide users with quick access to data and functions.
Green Keys – Action Keys
Yellow Keys – Market Sector Keys
Red Keys – Cancel & Log Off Keys
Keys to know:
- Esc/Cancel – Think of it like a normal Escape key. Striking it will stop whatever you are doing.
- Enter/GO – Think of it like a normal Enter key. You will use this after every command that you enter.
- Menu – Press Menu to navigate from any function back to a menu of related functions (and ultimately back to the main menu).
- End/Back – Will take you back to the key previous screen.
- Help – Press the Help key once to display the help function and a description of the current function that you are using. Press help two times to email the Bloomberg 24 hour help desk.
Basic Searching
Browsing Menus
Bloomberg functions are organized by menus that are classified by market sector or product type. Each menu is part of a hierarchy.
You can access menus using the Menu button on the screen, the Menu Key, or using a Yellow Market Sector Key. This method is recommended for new users – It gives users a sense of the data and information available in Bloomberg and sees what functions are available.
Using Function Codes
An alternative to using the menus is to search by function code. By entering codes directly into the command bar, users can eliminate the steps.
There are two types of function codes: Security Specific, for analyzing loaded securities, and Non-Security Specific, for locating information on a sector or news & events.
To load a security, enter the ticker or identifier, hit the Market Sector key representing the asset type, and then click on the Enter/GO key.
Launchpad
Launchpad is a powerful feature that gives users the ability to combine & consolidate the Bloomberg content that you use most. Monitor data, group components, customize function panels and share ideas with other Bloomberg users with this unique tool.
Company information
Use the <Equities> menu to begin company research. You can type the company name and use the Bloomberg autocomplete to load a security. You can also search companies by using the Ticker symbol.
If you are unfamiliar with a company, begin with the <DES> function that will give you an overview of the company. I also suggest reading the annual reports and company filings for information about the company’s management and strategy. Financial statements and ratios can be found in the Financial Analysis screen <FA>.
Graphing and other analytical tools are available to users in the charting and reporting functions. You can find other important functions in Bloomberg’s Equities Cheat sheet.
Equities Analyst Cheat Sheet
Find a Company or Equity
Searching for a company or security
- Enter the Security Ticker, <Equity>, Go
- TGT<Equity> Go
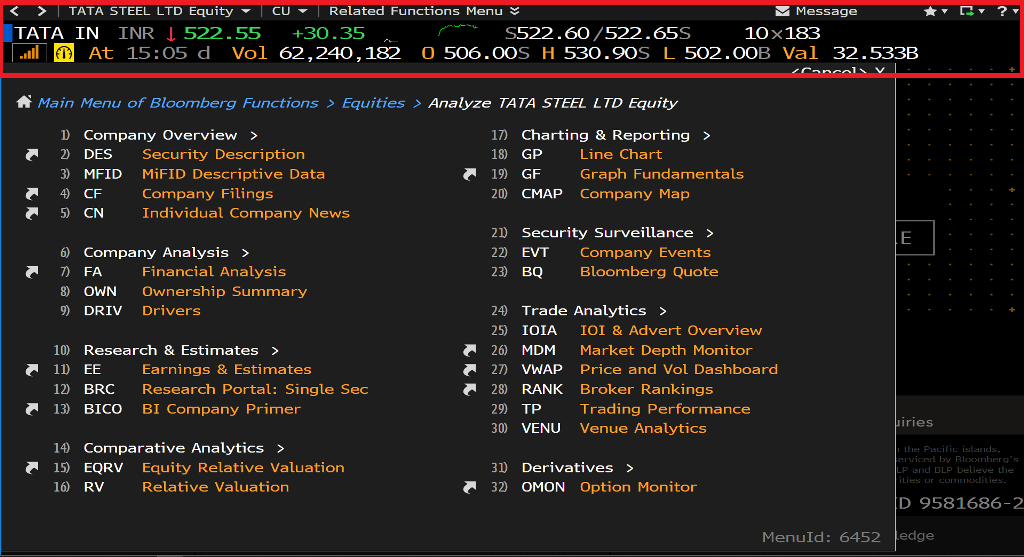
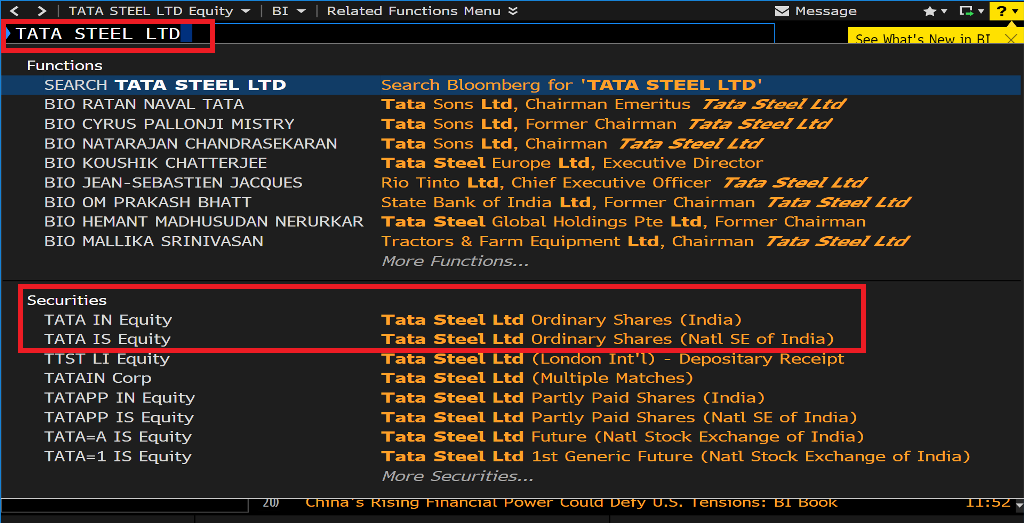
- If you don’t know the ticker, enter the name of the company, click on Go, and select the firm from the list under Securities
- Target, Go
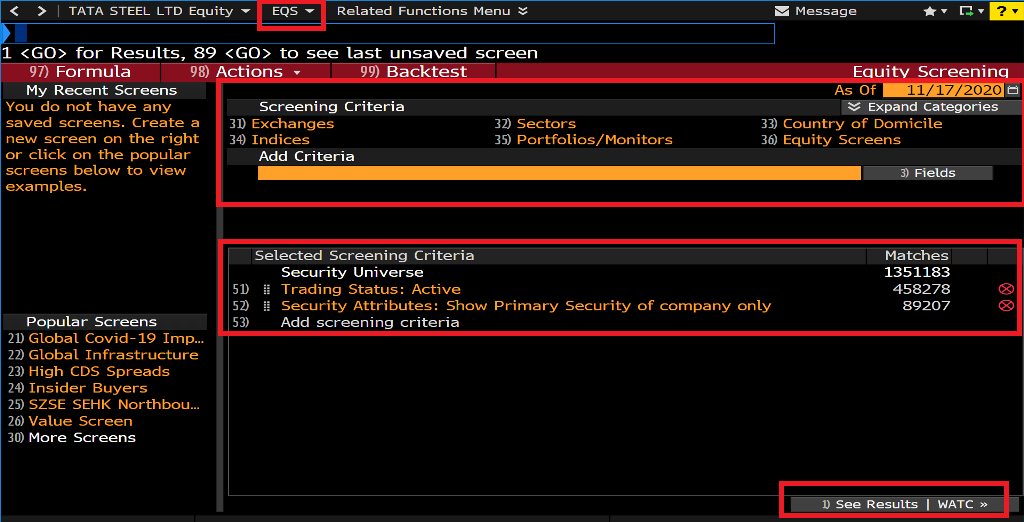
Screening for companies or equities
Enter EQS <Go>
You will be able to select criteria to create filters. You can select an industry sector and drill down to a specific industry, country of domicile, or any of the other options listed.
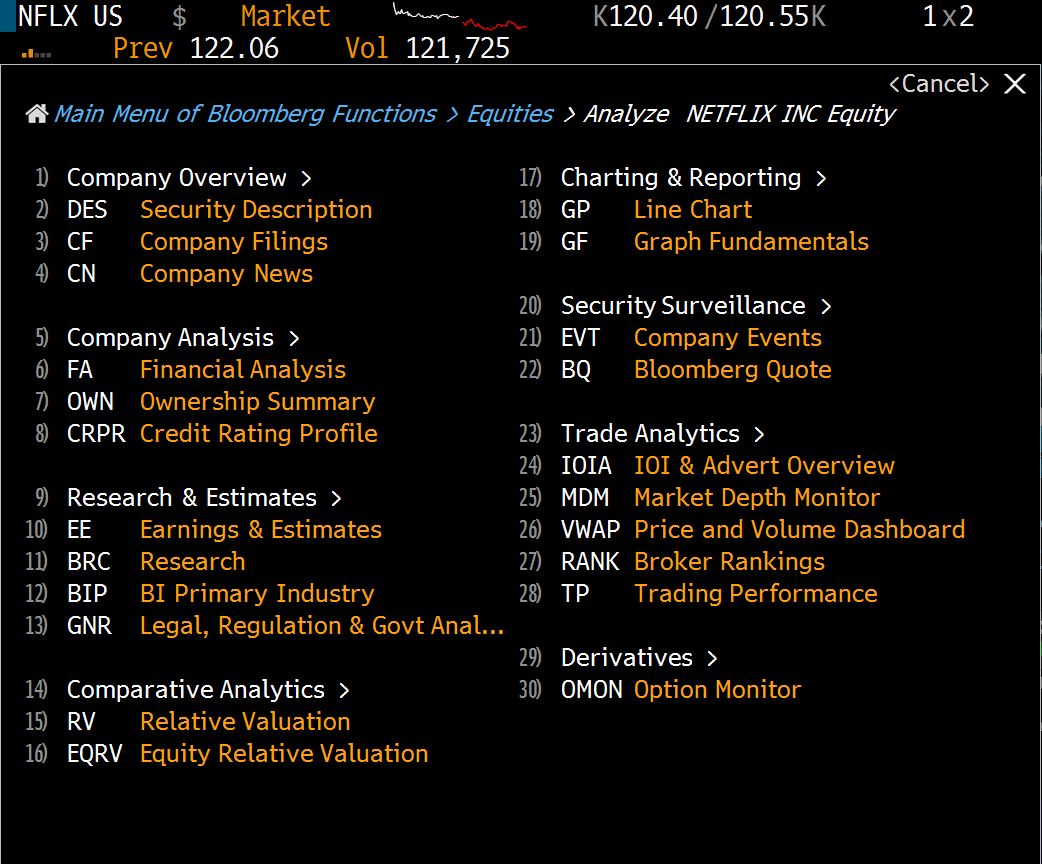
Frequently Used Function Codes for Analyzing a Company
If you already know the ticker of the security or company that you are searching for, enter:
TICKER <EQUITY> FUNCTION <GO>
Once the Security is loaded in Bloomberg, these commonly used functions can help with your analysis.
DES*: Company Description
BQ: Display price, trade, earnings, & relative value on a single screen.
CN: Company News and Research
MGMT: Management structure and profiles
HP: Historical Prices table
GP: Price Graph
GIP: Intraday Price Graph
G: Create custom graphs
ANR: Analyst Recommendations
BRC: Broker/Analyst reports
EM: Earnings Matrix (multiple templates)
RV: Revaltive Value – Peer Group Analysis
FA: Financial Analysis
Industry Information
The <BI> menu is the best place to start when looking for industry information. In this example, access the <BI> menu through the company Pepsi or PEP. The data library in the <BI> menu is where you can find the market share and valuation. The valuation menu will help you compare companies within the same industry by looking at their key indicators and other industry-specific metrics. These key indicators will vary from industry to industry, sector to sector. The litigation dashboard is also a good place to find any legal cases.
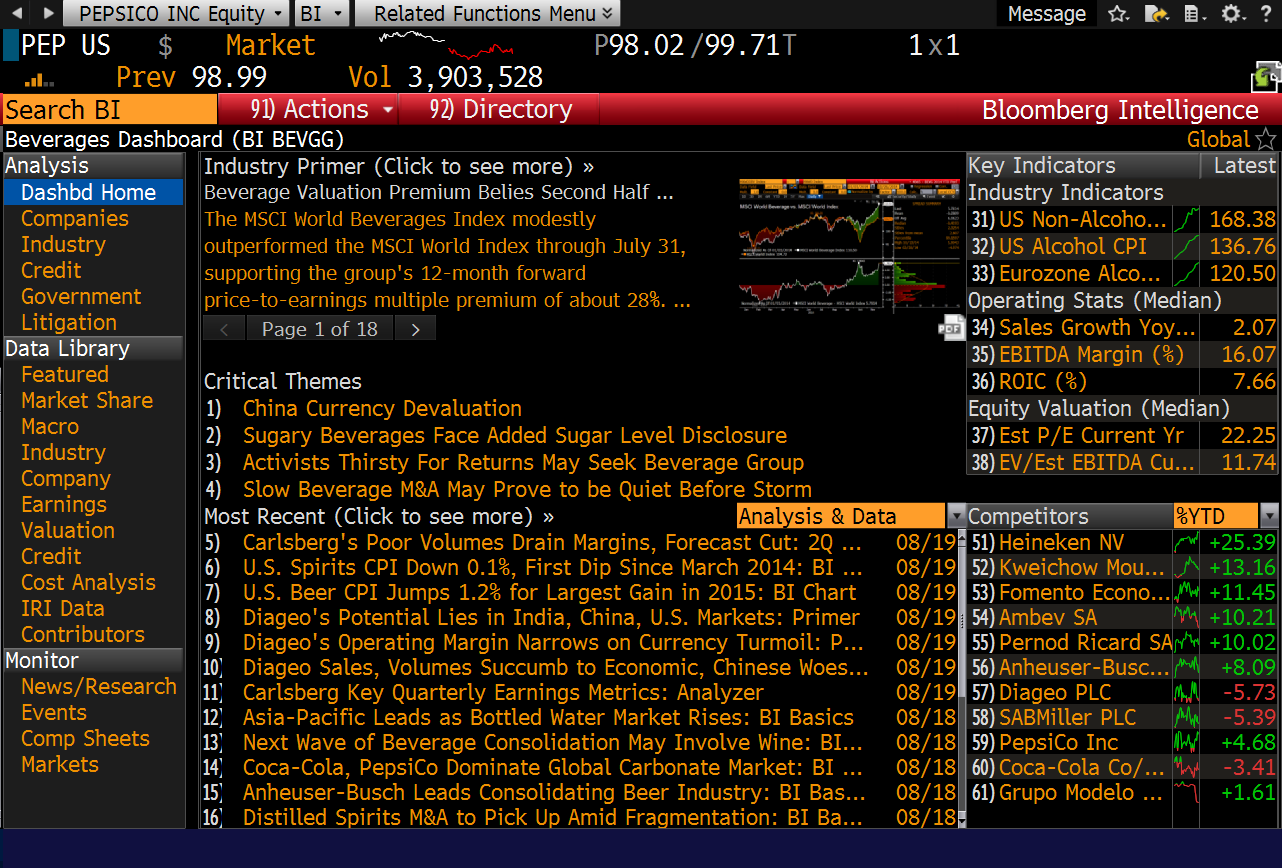
Bloomberg Industries combines the insight from industry analysts with comprehensive data to provide users with a complete view of an industry and its key constituents. To access Bloomberg Industries enter BI.
Bloomberg Industries covers over 100 industries across the following Sectors: Communications; Consumer Discretionary; Consumer Staples; Energy; Financials; Health Care; Industrials: Materials; Technology; & Utilities.
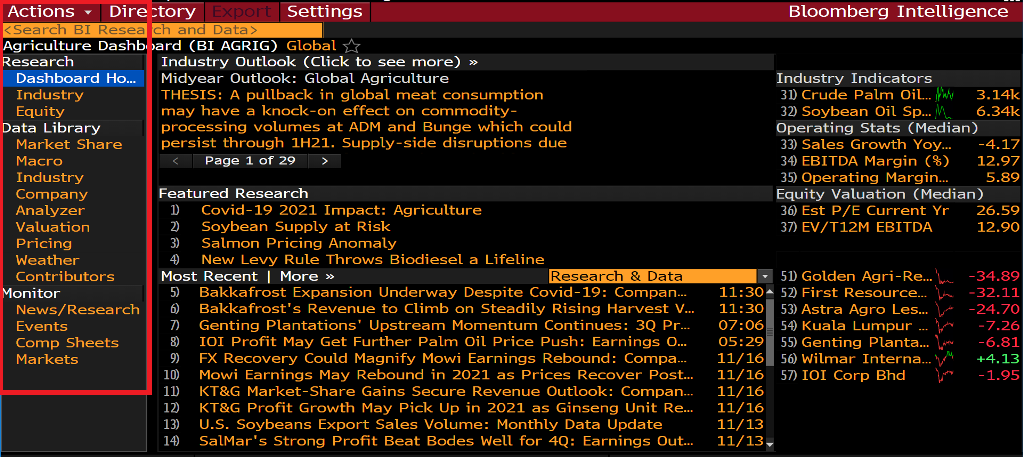
Each industry home page features individual modules – Research, Data Library, & Monitor – allowing users to locate more in-depth industry information.
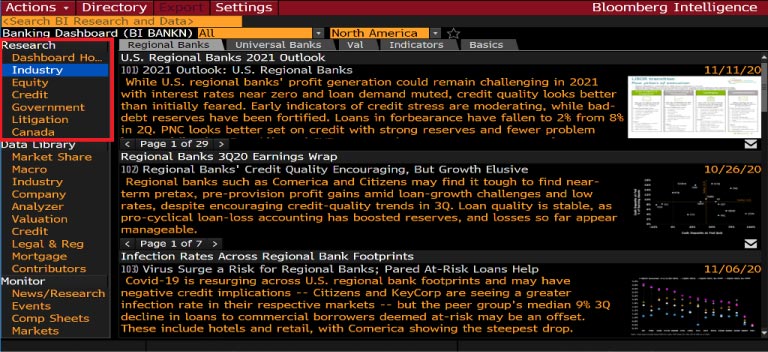
Research
BI Research incorporates data as it becomes available and presents it with live links to charts, reports, and other tools.
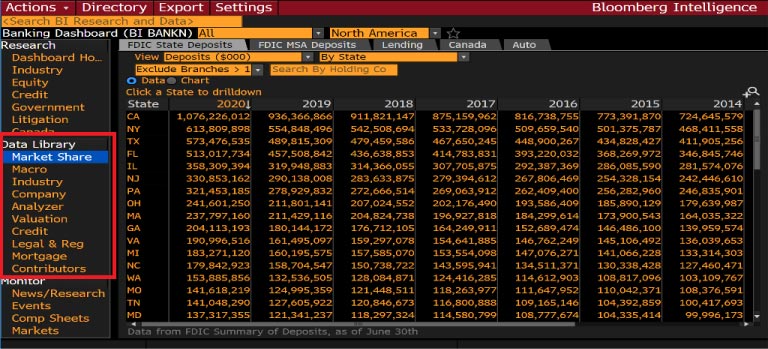
Data Library
The Data Library features data-sets specific for each industry and includes macro and industry factors and company-level operating, financial, and valuation statistics.
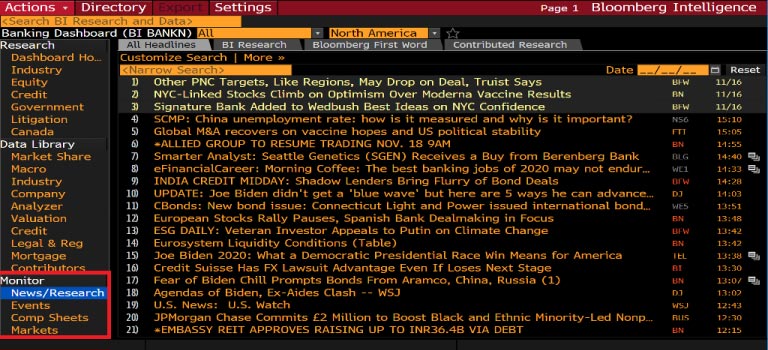
Monitor
The Monitor module provides real-time access to data and news specific to an industry.
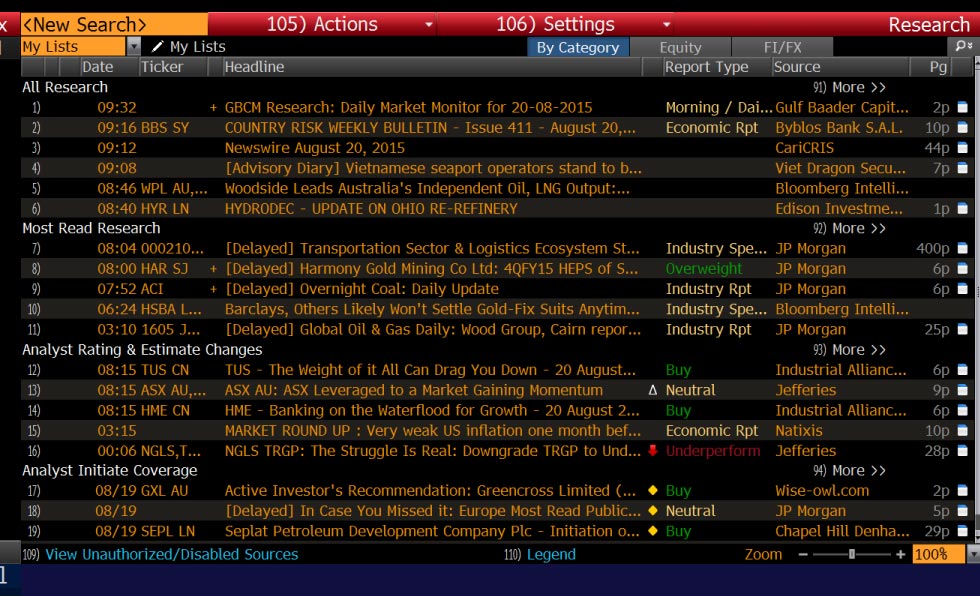
What Is Research Portal (RES) / Research <BRC> + <Go>?
RES/BRC is your gateway to research from over 2,500 providers, including brokers, independent providers, market research firms, industry associations, and other premium content. As a single destination for research on all securities (RES) or a single security (BRC), RES/BRC provides aggregated, customizable views for research on a single screen, so you can easily access in-depth research that is important to you, including ratings changes, initiated coverage, earnings estimate revisions, and economic research. RES/BRC is integrated with the Trade Ideas (TMSG) and Bloomberg Notes (NOTE) functions, so you can see trade ideas and add notes to research for reference or sharing.
RES/BRC is divided into a control area, a research list, and a set of list resources. Your selections in the control area determine the content that appears in the research list, from which you can access research and additional functionality.
What Is Bloomberg Intelligence <BI> + <Go>?
BI provides analysis on industries, companies, and expert topics, delivering key data and interactive charting from BI analysts with an average of seventeen years of experience in their given industry. Topics include government and legal issues; environmental, social, and governance (ESG) standards; and credit coverage. BI offers timely analysis that leverages Bloomberg’s earnings consensus, price targets, ratings, and estimates products, and compiles extensive data across industries into one platform, so you can gain deeper insight into an industry or topic. BI allows you to download data, so you can create your own models and analysis.
BI is organized into two primary screens: the directory landing screen, which displays the hierarchy of research and analysis available in BI, and dashboards, which allow you to analyze an industry or topic and its key constituents.
Bloomberg Excel Add-in
Bloomberg Excel Add-in
The Bloomberg Excel Add-In is a powerful suite of tools bundled with the Bloomberg Professional service that allows you to deliver market data, historical data, reference data, and analytics.
To use the Excel Add-In, you must be logged into the Bloomberg terminal.
Working with the Excel Add-In
- Use the Spreadsheet Builder
Spreadsheet Builder makes it easy to import Bloomberg data into a spreadsheet by automatically generating the appropriate functions through an easy step-by-step process.
You can launch the Import Data wizard by, selecting Spreadsheet Builder from the Bloomberg Menu or by clicking on the Import Data icon on Excel toolbar.
BI is organized into two primary screens: the directory landing screen, which displays the hierarchy of research and analysis available in BI, and dashboards, which allow you to analyze an industry or topic and its key constituents.

Select the type of data you want download, then follow the steps.
- Use Worksheet Functions in Excel
Bloomberg’s worksheet functions provide intermediate to advanced Excel users flexibility to construct their own formulas to customize the way Bloomberg data is delivered and organized in the spreadsheet.
In the Excel Add-in, Bloomberg functions are consolidated with flexible optional parameters:
- BDP (Bloomberg Data Point) is for current data.
- BDH (Bloomberg Data History) is for historical end of day and historical intraday data.
- BDS (Bloomberg Data Set) is for large data sets/ bulk data.
When using any of the formulas, you must specify the security for which you want to retrieve data (Security), and you must specify the data item you want to retrieve (Field). The Security must be represented as (Ticker) (Market Sector), for example TGT Equity.
Fields are represented by mnemonics. Use the Field Search tool in Excel to search by category or keyword.

Alternatives to using the Excel Add-In
Copying and pasting tables from Bloomberg to Excel
- Place cursor at the corner of table in Bloomberg.
- Click and drag the data you would like to copy. Bloomberg will copy text/data automatically without Ctrl + C.
- In Excel, press Ctrl + V to paste the data.
- Click on Data menu from the top in the Excel screen and select “Text to Columns…”
- Select “Fixed width-general.”
Screenshots
To save a screen go to Export, click on Grab Screen. Not all screens can be saved. You can also type GRAB <GO>
Bloomberg Professional Service Resource Center
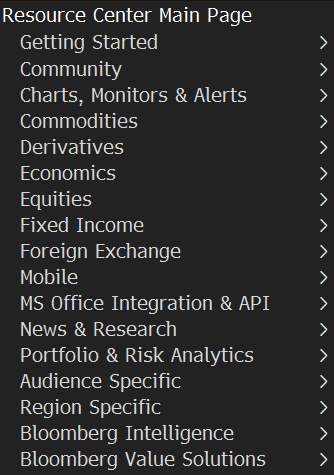
BPS provides access to marketing materials that help you learn more about the functionality available in the BLOOMBERG PROFESSIONAL service.
The Bloomberg Professional Service Resource Center screen is a toolbar from which you can search, share, and filter materials on how to use the Bloomberg. You can access documents and videos in a navigation sidebar. To access the Bloomberg Professional Service Resource Center type <BPS> + <GO>.
Bloomberg Guide and Cheat Sheets (PDF downloads)
Getting Started Guides
How to Create Bloomberg Login
Getting Started with Bloomberg Help Page
Introduction to Bloomberg For Students
Getting Started Cheat Sheet with Essential Codes
Search Help
Equity
Equity Portfolio Manager & Analyst Cheat Sheet
Technical Analyst Cheat Sheet
Fixed Income
Fixed Income Cheat Sheet
Government Agency Trader Sales Key Functionality
IRS and Structured Notes Key Functionality
Fixed Income Worksheet Overview
Commodities
Commodities for Equities Key Functionality
Shipping Key Functionality
Foreign Exchange
Foreign Exchange Key Functionality
Tools for the FX Market
Economics
Agriculture
BMC – Bloomberg Certificate Course
Bloomberg Market Concepts (BMC) is an 8-hour, self-paced, e-learning video course consisting of four modules: Economic Indicators, Currencies, Fixed Income, and Equities.
BMC Course will Help you:
Learn about the financial markets. Familiarize yourself with over 150 Bloomberg terminal functions.
Solidify your knowledge with over 200 interactive questions.
BMC is a free program if completed on the Terminal. Users can complete BMC on the Bloomberg Education website at no cost.
How to Start BMC:
- To learn more about the program, please visit https://portal.bloombergforeducation.com/login.
- To begin the BMC training program on the Terminal, log in with your Bloomberg account, enter BMC and click the green GO key.
- To the Bloomberg Market Concepts Training, after you log in, type BMC in the cursor and press or Enter of <GO>.
